Beyond the Hype: Inside the 116% throughput surge at Cloudflare, Vercel, OpenAI, Google, Meta, and Microsoft
Five quarters of commit‑level data from public repositories at six of the most closely watched engineering organizations — the first systematic measurement of what AI‑assisted code is actually doing inside Big Tech.
Lead
SAN FRANCISCO · Apr 29, 2026
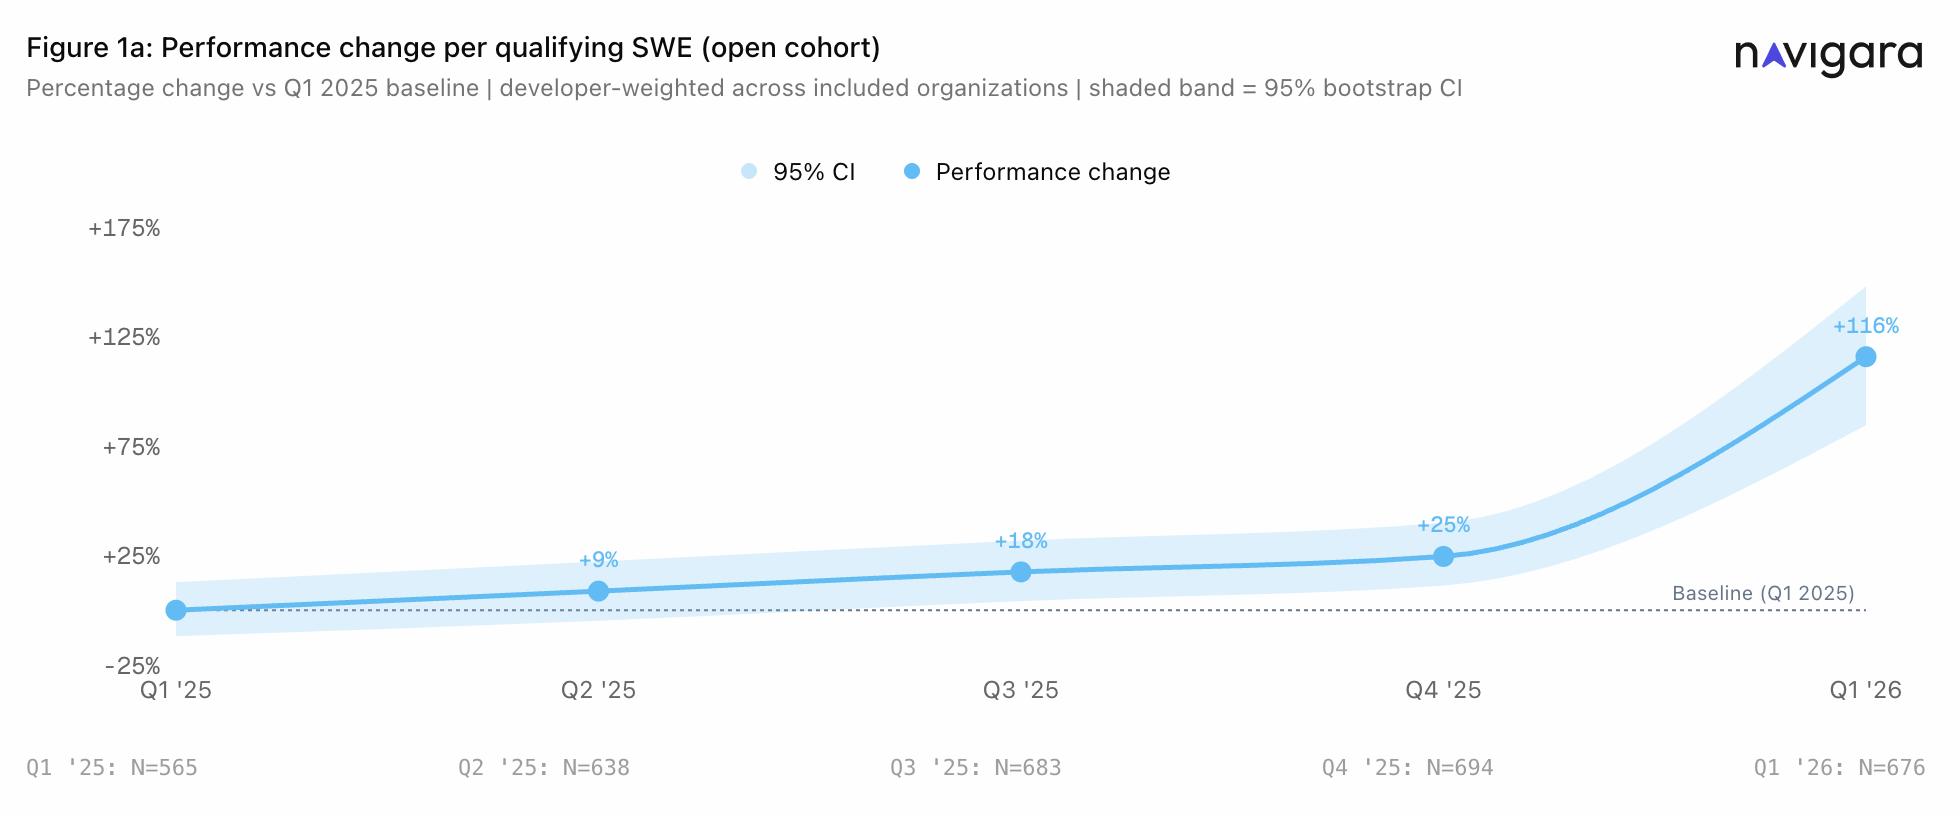
Engineering throughput value (ETV) across six of the most closely watched technology organizations more than doubled over the past five quarters. Between Q1 2025 and Q1 2026, average developer performance rose by 116%, according to new research released today.
The measurement engine was designed to understand code the same way a senior engineer does: not just what changed, but what the change meant, where it landed, and whether it changed the architecture. The study analyzed every merged commit to the default branches of public GitHub repositories at Cloudflare, Vercel, OpenAI, Google, Meta, and Microsoft between Q1 2025 and Q1 2026. Each commit was scored by a two‑layer engine that produces three work‑type sub‑scores (Growth, Maintenance, and Fixes) before aggregating them into a single scalar, the Engineering Throughput Value, per commit.
Disclosure
A short note before the data. Navigara built the measurement engine used in this paper. We have a commercial interest in the conclusion that engineering work is harder to measure than most teams assume. The paper below makes only descriptive and correlational claims. Methodology, sample boundaries, and known limitations are documented in the white paper. If you find a flaw, write to research@navigara.com. We will publish corrections in a public changelog on this page.
Q1 2025 → Q1 2026
Per‑organization performance change and Q1 '26 work‑type composition
| Organization | Performance change vs. baseline | Q1 '26 Maintenance & Fixes | Q1 '26 Growth |
|---|---|---|---|
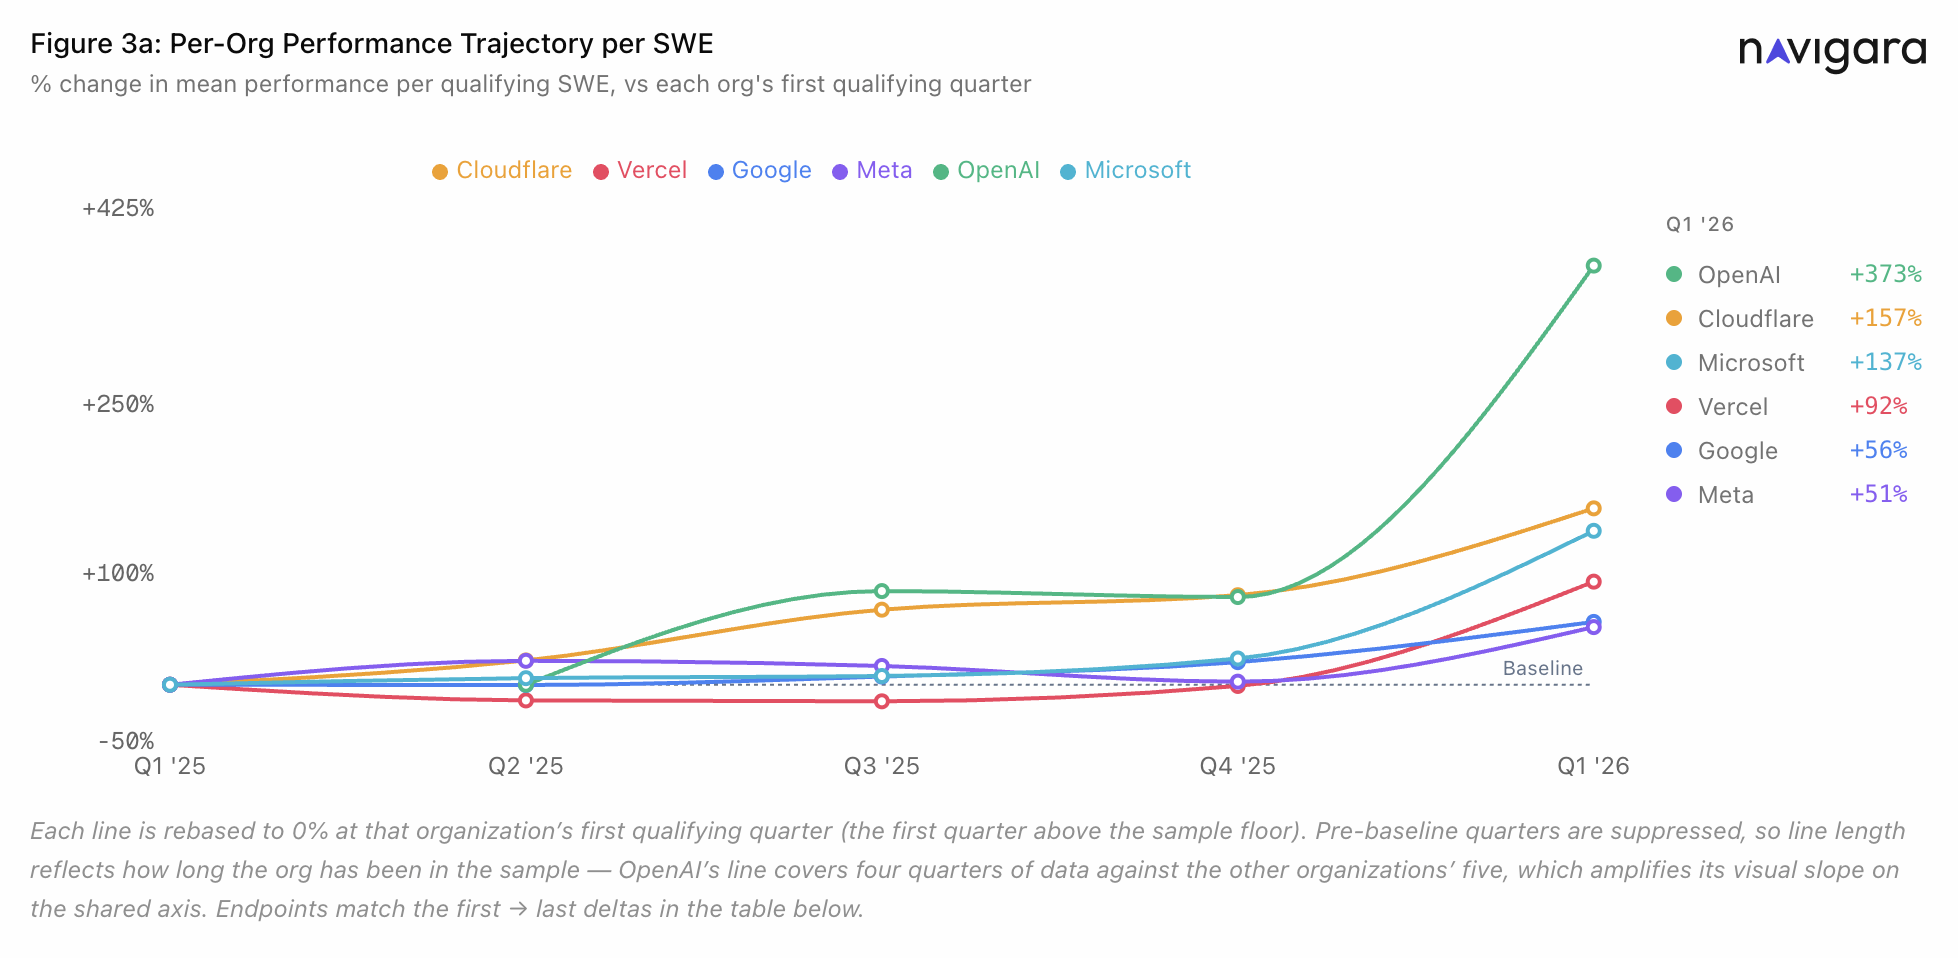
| OpenAI* | +373% | 57% | 43% |
| Cloudflare | +157% | 66% | 34% |
| Microsoft | +137% | 57% | 43% |
| Vercel | +92% | 67% | 33% |
| +56% | 70% | 30% | |
| Meta | +51% | 70% | 30% |
Source: Navigara Research, commit‑level analysis of 66 public repositories, Q1 2025 – Q1 2026.
* OpenAI's Q1 2025 cohort fell below the study's sample floor of 20 qualifying engineers. Its +373% figure covers four quarters (Q2 2025 – Q1 2026) rather than five.
The Value Gap
The results align with what engineering leaders have been reporting publicly and privately for 18 months as AI coding tools have spread across the industry.
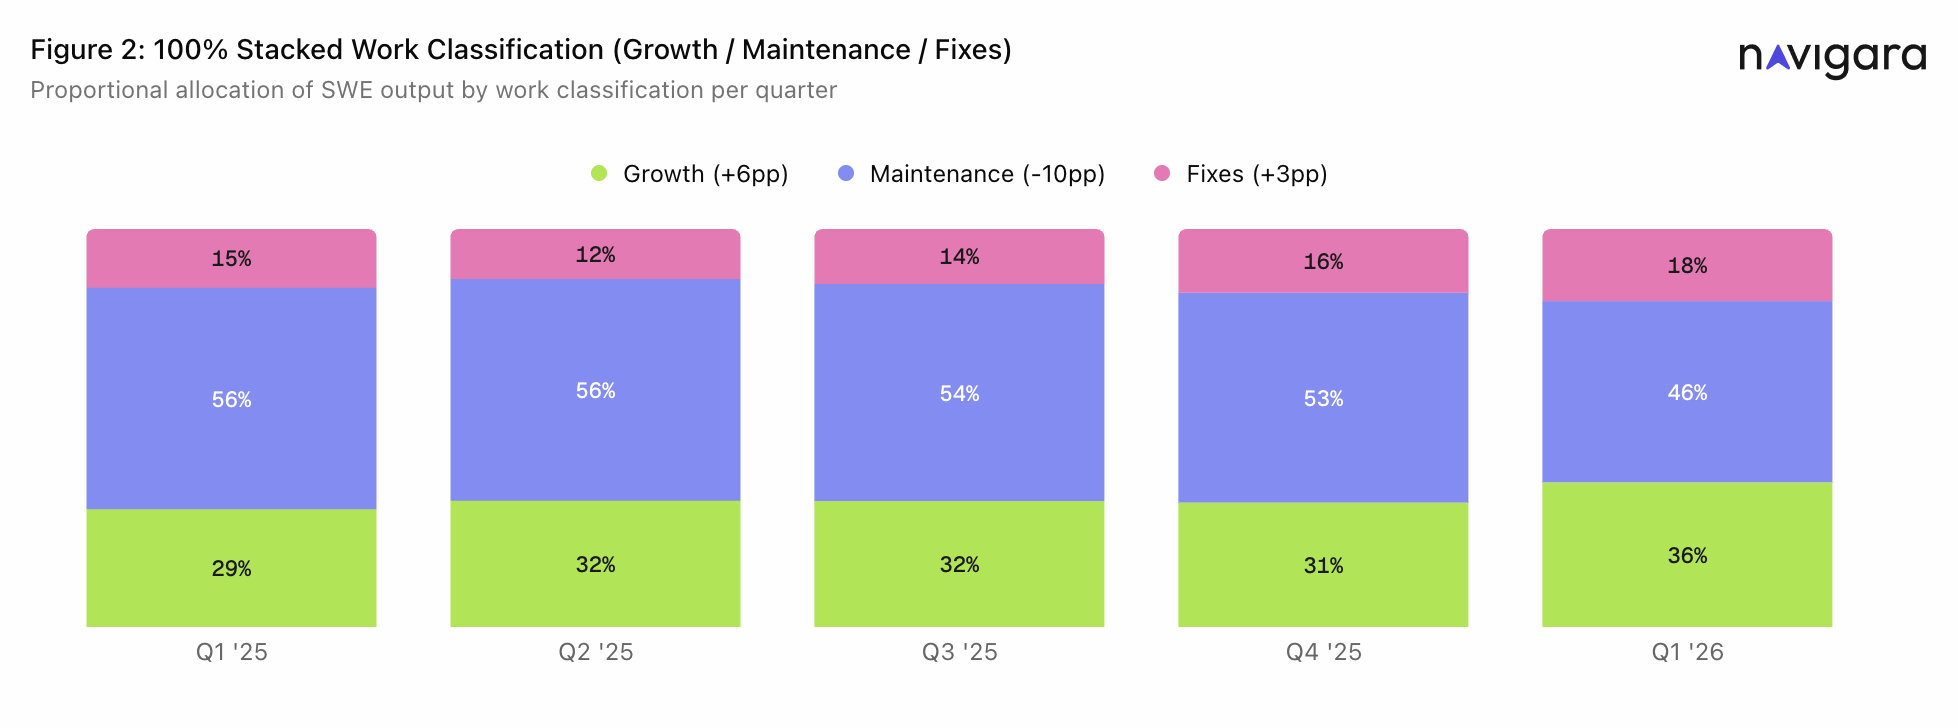
The second finding is the one the industry has not yet publicly reckoned with. Even after the doubling, the majority of engineering output in every organization is still maintenance and fixes, not new features customers can see, use, or pay for.
In Q1 2026, that share ran from 57% at OpenAI and Microsoft to 70% at Google and Meta. Across every organization in the sample, the majority of Q1 2026 output is still maintenance and fixes. Teams are shipping faster. The composition of what they ship has barely moved.
“The productivity gains from AI tools are real, and the speed‑up is not linear. Teams are shipping substantially faster. But every company and team differs, and developers are still learning how to achieve high, sustainable performance over a longer period of time.”
Jirka Bachel
Co‑founder and CEO, Navigara · co‑author
The Accountability Window
As enterprise technology budgets tighten and AI coding tools reach every organization regardless of size, a new mandate for empirical proof has replaced executive intuition. While millions of developers have integrated AI into their daily workflows, the data that would answer the board‑level question has sat unread in the commit logs.
As companies pour billions into AI tooling, the question is no longer how much is being spent. It is what that spend is actually delivering.
Boards and CFOs are no longer asking whether teams use AI; they're asking how much performance each dollar of AI tooling produces. High performance with AI is not driven solely by coding tools. Tools like Claude or Copilot are one layer, where real gains come from how AI is integrated across the engineering system, from architecture to workflows to decision‑making. Adoption is widespread, but a clear view of AI's return isn't. The answer has been sitting in commit‑level data all along. Until now, no one had measured it at this resolution.
“Navigara's approach, particularly its ability to analyze work at the commit level and connect it to meaningful outcomes, tackles a problem the industry has struggled with for years.”
Tomáš Krátký
Built Manta into a globally recognized enterprise data lineage solution before its acquisition by IBM; now invests in companies that materially improve how enterprises reason, build, and operate.
Methodology
Two‑layer design. 66 public repositories.
The study used a two‑layer design. A per‑commit scoring engine produced three sub‑scores for every merged commit to the default branches of 66 public repositories across Cloudflare, Vercel, OpenAI, Google, Meta, and Microsoft: Growth, Maintenance, and Fixes. Each score begins with a context complexity signal derived from the structural properties of the change, scaled by an engagement multiplier that weights targeted modifications in complex areas above equivalent changes in trivial code.
Organization selection. The six organizations were not sampled randomly. Three — Cloudflare, Vercel, and OpenAI — were selected because each makes frequent public claims about AI productivity gains in its engineering organization. The other three — Google, Meta, and Microsoft — were selected as incumbents of substantially larger scale with strong public reputations for engineering talent density. This is a purposive sample, not a representative one.
Decay factors correct for authenticity. A similarity dampener reduces credit for mechanical refactors and copy‑paste patterns. A blame decay factor discounts changes that overwrite very recent work by the same author. A copy decay factor penalizes commits that add lines that are duplicated from elsewhere in the codebase. For Fixes, a waste multiplier reflects how long the original code existed and how often the affected area had been modified. Machine‑learning components tune thresholds and coefficients within this structure; a large‑language‑model classifier resolves ambiguous work‑type classifications where pattern‑based signals are insufficient.
The report layer sums the three sub‑scores into a single scalar per commit, the Engineering Throughput Value (ETV). The change from Q1 2025 to Q1 2026 reported here is the developer‑weighted mean ETV across qualifying Software Engineers in each quarter, so every qualifying engineer contributes one observation, regardless of company size. On a fixed panel of 418 engineers active throughout the full window, the same metric rises +98%. Roughly 85% of the headline survives holding the population constant.
About the Research
This white paper is the first public release from Navigara's open source research team, which studies engineering output at the commit level across public code. The team publishes methodology, category taxonomies, and classifier data openly. Code, data definitions, and the full technical appendix for this study are available at navigara.com.
Co‑author
Peter Malina
14+ years scaling engineering platforms. Most recently led the platform organization at Kiwi.com, serving tens of millions of customers monthly.
Co‑author
Jirka Bachel
18+ years of technical leadership across Silicon Valley and Prague. Third time as CTO. Previously Lead Developer at Seznam.cz, building a browser for 1.5M monthly users. Co‑founder and CEO of Navigara.
Corresponding author: research@navigara.com
About Navigara
Navigara is the performance measurement platform for the modern engineering organization. Based in San Francisco and Prague, Navigara connects to GitHub, Jira, and Linear to translate engineering execution into actionable signals for leadership.